Summary: Brazil shipped 803,000 MT of soybeans last week. That’s down from the previous week’s 947,000 MT but it is above a year ago. In the Dec WASDE, the USDA raised their projection for Brazil’s old-crop exports by 3.35 MMT to 84.2 MMT (on a Feb-Jan marketing year). To accommodate the increase in exports, USDA raised old-crop beginning stocks by 5.15 MMT. However, the projection for new-crop exports was slashed by 5.6 MMT to 70.0 MMT – – down 16.9% YoY. As of Feb 08, new-crop (Feb’19-Jan’20) export commitments were 8.9 MMT, a record for this date and 11% more than last year. There were 7.7 MMT scheduled to ship in Feb and 1.17 MMT scheduled to ship in Mar.
++++++++++++++++++++++++++++++++++++++++++++++++++++++++++++++++
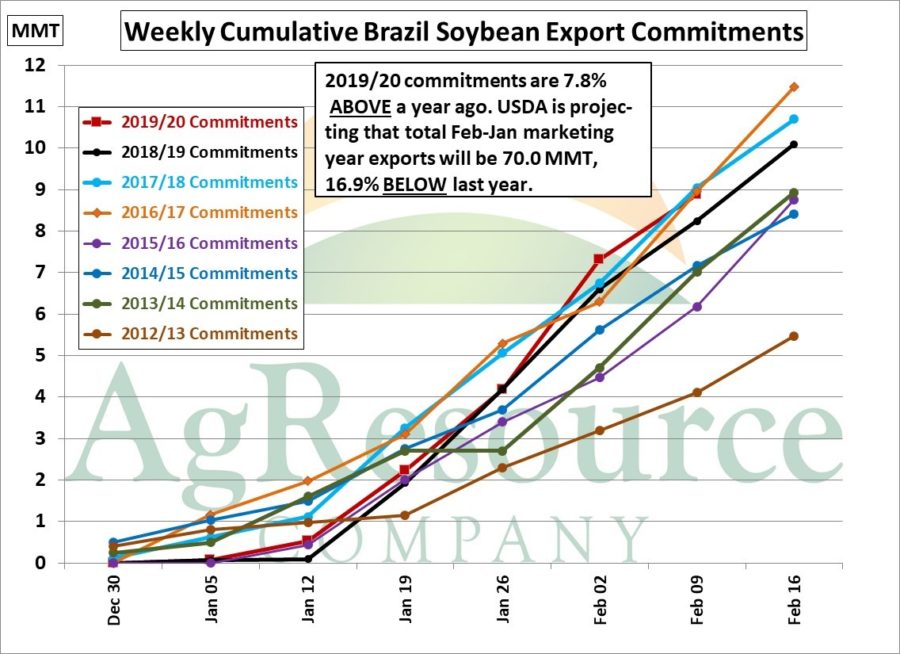
For the period Feb 02-Feb 08, Brazil exported 803,000 MT of soybeans. That’s down from the previous week’s 947,000 MT but it is 200,000 MT more than a year ago. Brazil’s soybean export “commitments” (shipments to date, vessels loading or waiting, and vessels to arrive) were estimated to be 8.9 MMT (see red line in chart below), 1.58 MMT more than week go. Commitments are a record for this date and up 11% from a year ago (on a prorated basis).
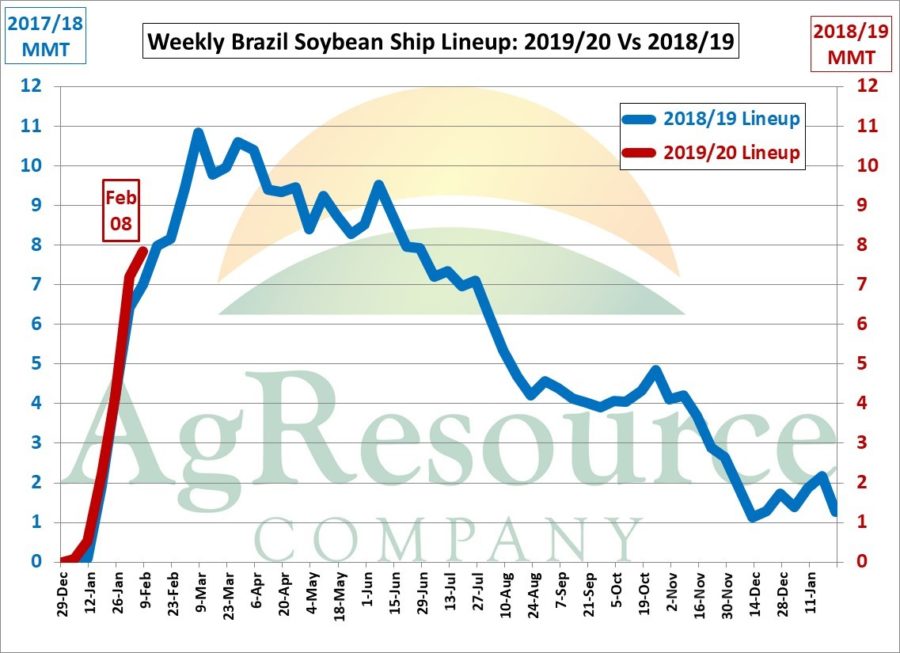
There was 7.84 MMT in the lineup waiting or scheduled to arrive. A year ago, there was 7.0 MMT in the lineup. Last week there was 7.19 MMT in the lineup. Based on the ship lineup as of Feb 08, Brazil’s February export shipments will be 7.72 MMT. That would be above last year’s “shipments” of 5.58 MMT and more than last year’s SECEX’s “official” February exports of 2.86 MMT. There was 1.17 MMT that was scheduled to ship in March.
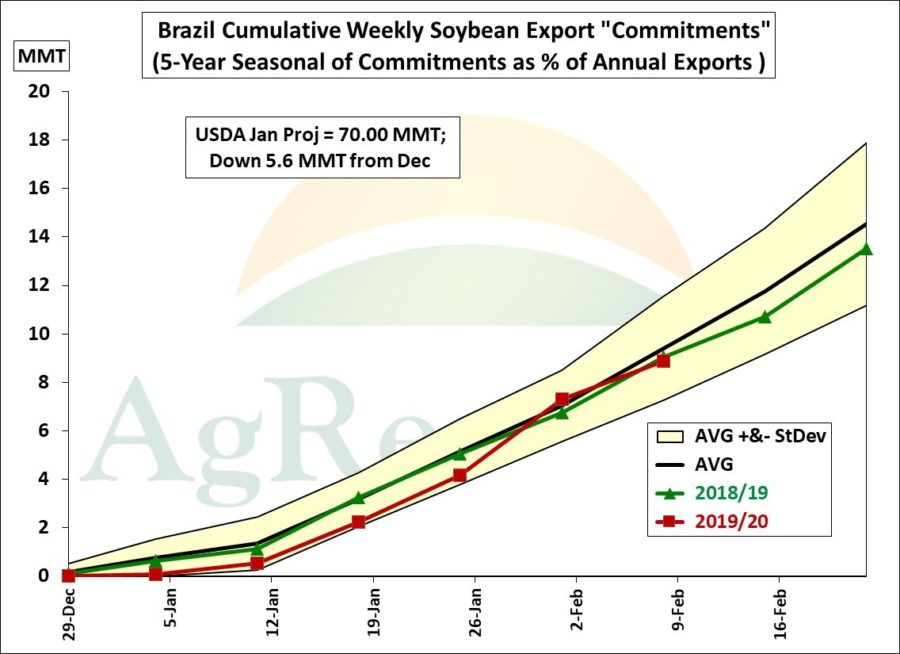
The chart below shows the seasonal of weekly cumulative export commitments for 2018/19 (red squares) vs last year (green triangles). Export commitments are just below the middle black line which represents the “average” pace (black line) needed to meet the USDA’s export projection for 70.0 MMT. USDA’s local marketing year for Brazil’s soybean crop begins Feb 1. Commitments have now accounted for 12.7% of USDA’s projection vs last year’s 9.8% and the 5-year average of 13.4%.
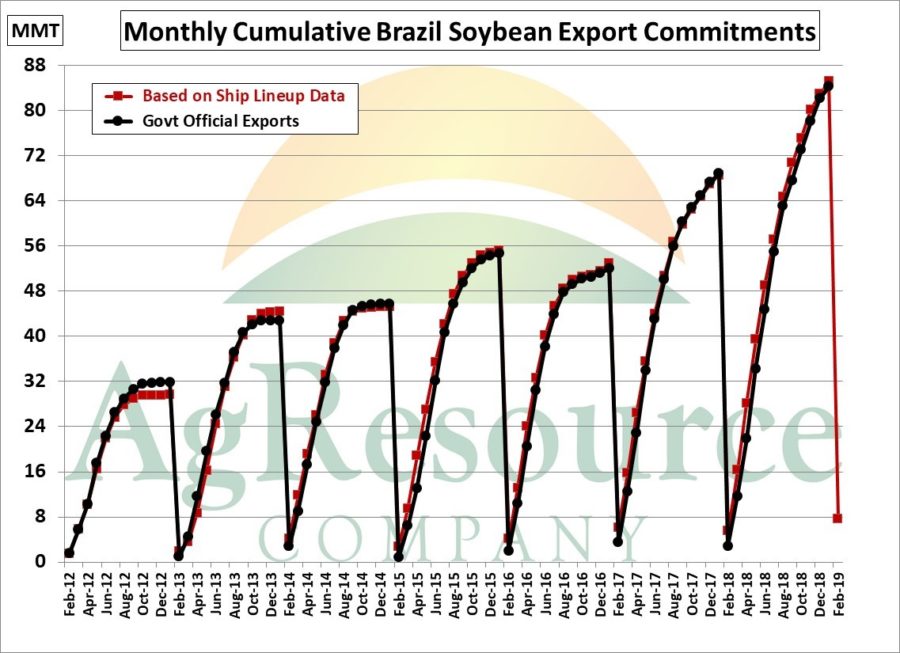
The chart below shows the seasonal of this year’s Brazil monthly soybean exports (based on the international marketing year of Oct-Sep 2018/19). Shipments are the black circles and official SECEX exports are the red triangles. Also shown (as green squares) are last year’s SECEX exports. The 5-year average of monthly exports (measured as a percent of annual exports) is depicted by the solid blue line (read off the left axis).
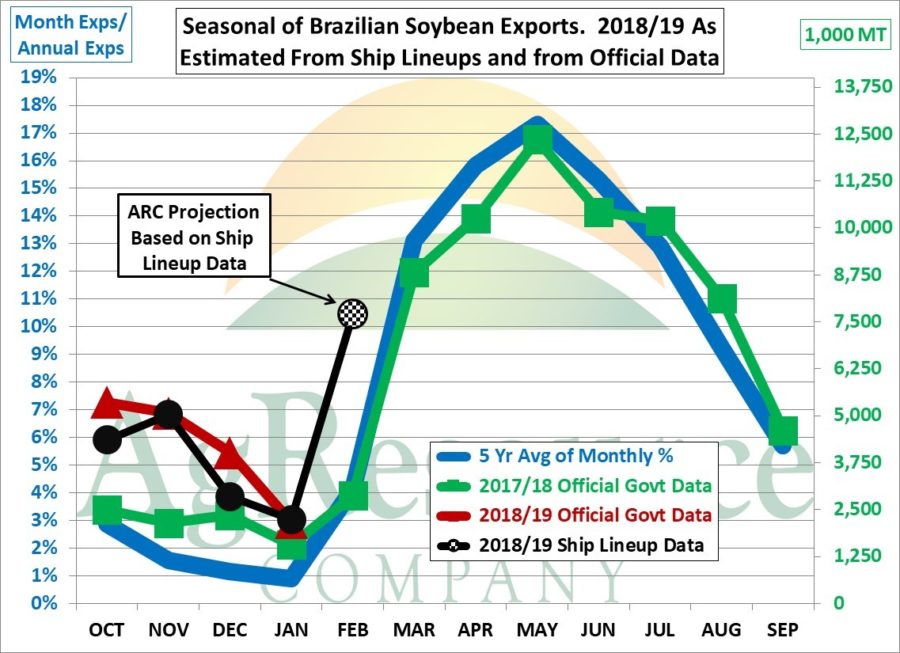
At this time of year, it is common for official SESEX monthly exports to lag behind shipments reported by cargo services. However, by the end of the local marketing year (Jan 31, 2020), cumulative shipments and official SESEX exports converge. For the year just completed, the difference between cumulative SESEX exports and cumulative shipments was just 1%.