

Over-the-weekend Sydney, Australia spiked to 117F the hottest in 80 years. The 90-day temperature anomaly tendency in Sydney certainly is hot (Fig. 1) and of course the lack of rainfall is enhancing the anomalous heat (Fig. 2). Â Foreshadowing the heat risk is the tendency for subtropical ridge areas which if amplified cause summertime drought and attendant heat to form across areas of unusually warm ocean temperatures.

Fig. 1: Daily average temperature departure from normal in Sydney, AU indicates a strong tendency for hot weather.
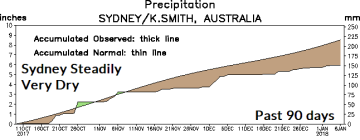
Fig. 2: Daily precipitation the past 90 days in Sydney, AU indicates drying which helps amplify hot weather.
During the past 2 seasons sea surface temperature anomalies (SSTA) east of Australia have become the warmest and most expansive of any region of the global oceans (Fig. 3). East of Australia to east of New Zealand SSTA have averaged an astounding +3C to +4C.
Across the super warm ocean surface the air aloft has been just as warm leading to a strong high pressure ridge centered on New Zealand extending westward into Australia into mid-summer (Fig. 4). Given the warm SSTA and ongoing summer climate this pattern is unlikely to change.
Note that upstream from the upper ridge a strong trough has dominated waters to the south of Australia. Occasionally, this strong trough has produced cold fronts capable of producing excessive rainfall not quite reaching Sydney. In December excessive rainfall affected a large part of Interior Southeast Australia (Fig. 5). The December thermal climate was certainly hotter across eastern Australia (Fig. 6).
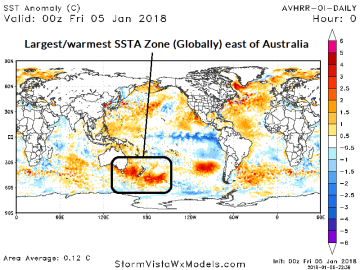
Fig. 3: SSTA east of Australia to east of New Zealand are the warmest regionally across the entire global oceans. Anomalous warm oceans during summer occur due to stronger than normal 500 MB subtropical high pressure ridging. The upper ridge pattern amplifies heat risk for nearby land masses.
Fig. 4: A strong upper ridge pattern extends from New Zealand to Eastern Australia associated with the warm SSTA east of the continent.
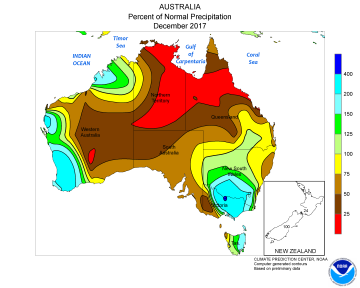
Fig. 5: The December 2017 Australia precipitation anomalies.

Fig. 6: The December 2017 Australia temperature anomalies.


